Intro to Application Monitoring
Which of these situations do you identify with more?
- A customer reports an issue and your team starts trying to reproduce it. Eventually it’s found that an error has been happening for a while, causing bad data, and it’s going to take a great deal to clean up. The customer is frustrated and other customers need to be notified, if you had only known sooner.
- You receive an alert from your synthetic (live) testing that a new error is happening. A new feature was turned on recently and logging suggests that the error stems from this new feature. Custom metrics show that only the test user has used the new feature. You turn off the feature and clean the test data, crises averted.
Chances are you live somewhere in between the two extremes above. If so read on, perhaps some of the following will be useful.
Overview
While at Mingle Analytics I helped put together an application monitoring system which helped us improve system performance, find unreported issues, and greatly speed up troubleshooting. The system also proactively tested the production system to help us quickly find issues before users encountered them.
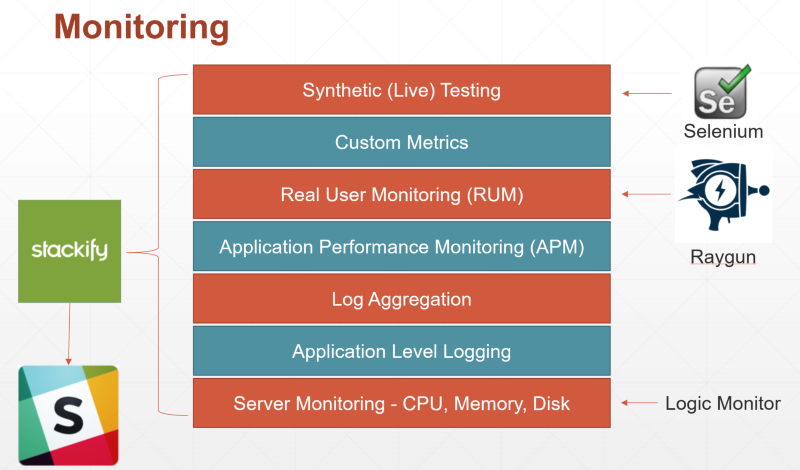
The image above shows the different types of monitoring and the tools that were used.
Lets take a look at each of the layers above and why you would use them.
I’ll be starting at bottom with the most common type and work my way to the top.
Here are some quick links if you want to skip to a section:
- Overview
- Server Monitoring - CPU, Memory, Disk
- Application Level Logging
- Log Aggregation
- Application Performance Monitoring (APM)
- Real User Monitoring (RUM)
- Custom Metrics
- Synthetic (Live) Testing
- Alerting
- Want to learn more?
Server Monitoring - CPU, Memory, Disk
Server monitoring is just what it sounds like: keeping an eye on your servers to make sure they are healthy. Is the CPU spiking? Do we have a memory leak, a bad disk? These are the types of questions you answer with server monitoring.
Server monitoring is typically run by the IT/Operations side. However, thanks to the DevOps movement, developers are becoming more aware of this type of monitoring.
At Mingle the IT group put LogicMonitor in place to do the server level monitoring.
Some Server Monitoring Tools
Resources
Application Level Logging
Application level logging is the first step to seeing what’s happening inside your running application.
Logging is accomplished by adding code to your application that will tell you what parts of the application are being used and if there are any errors.
Logging can be as simple as writing the info text to a file, though using a logging framework such as log4net or NLog provides additional functionality out of the box.
At Mingle we used log4net for application logging. We used the rolling file appender and kept a log file for each day of the month.
When Logging an Application:
- Use log levels to control the amount of logging.
- If running the app on multiple servers, include the server name in the log file to prevent file locking issues.
- Consider structuring your logs using JSON to help with later parsing.
- Make sure you log any handled as well as unhandled exceptions.
Some Application Logging Tools
Resources
- Logging Levels and how to use them
- C# logging best practices
- Structured logging
- Using log4net
- Using nLog
- The Art of Monitoring Book
Log Aggregation
Log aggregation pulls together all of your log files into a central location. Many tools allow the searching and filtering of log data to help zero in on the info needed.
At Mingle we used Stackify Retrace for log aggregation. We found it very easy to setup and immediately began to see some errors that we had missed in the log files.
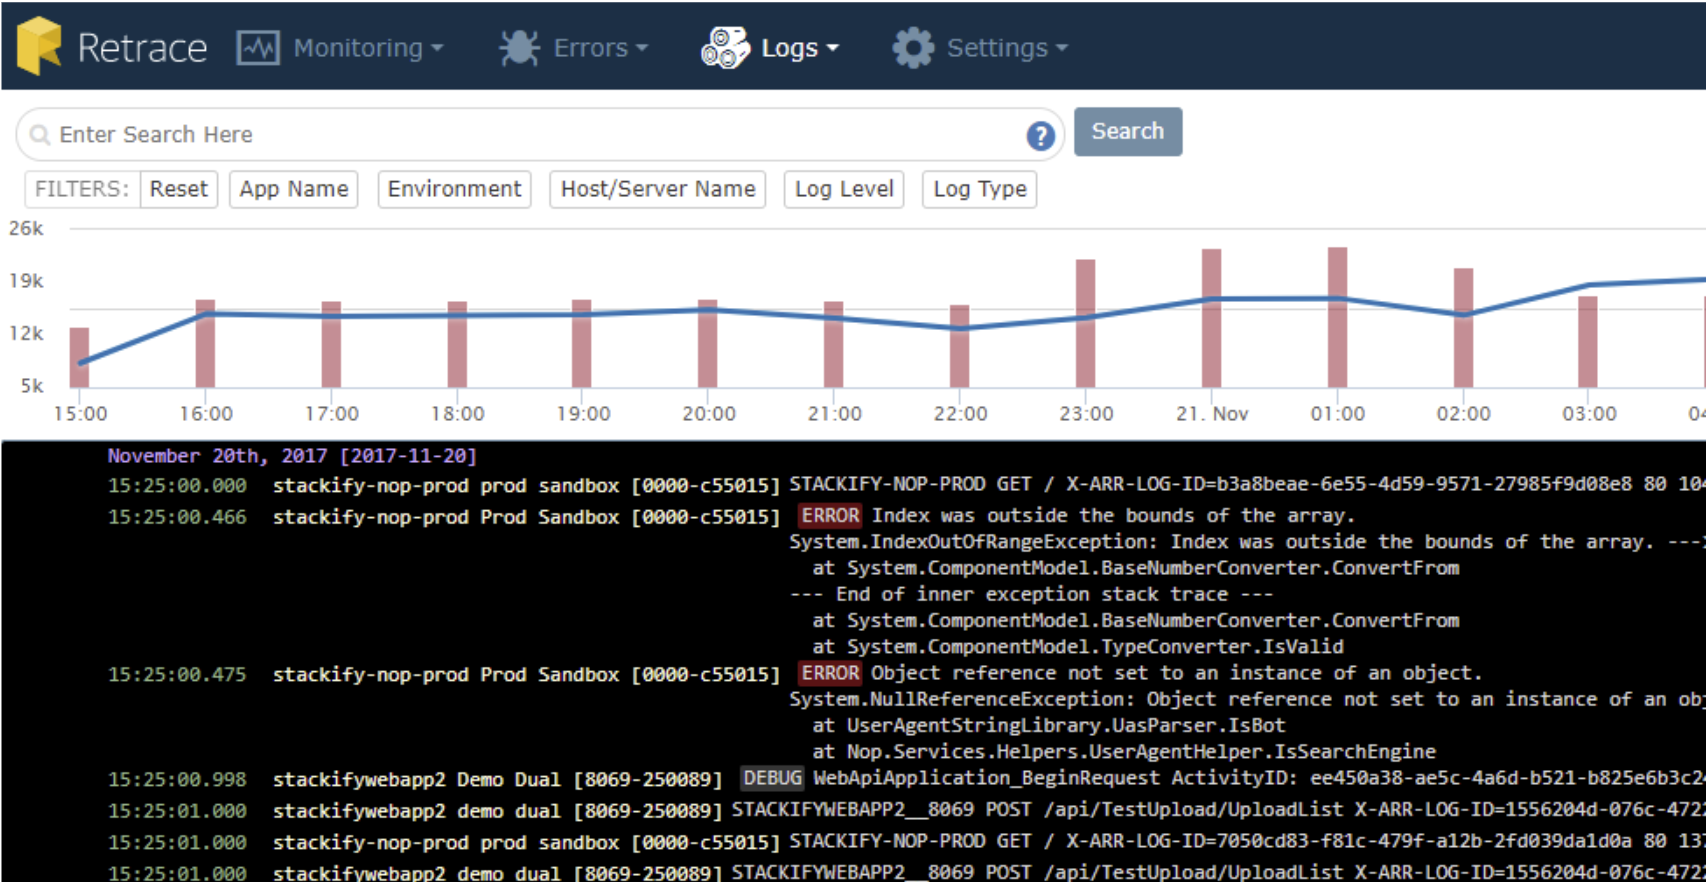
Useful features of Retrace log aggregation:
- Select a window of time and see the logs and other monitoring data all within the window.
- Receive alerts of errors and their frequency.
- Receive alerts when a search term is found in the log file.
Some Log Aggregation Tools
Resources
Application Performance Monitoring (APM)
APM tools typically help you see a breakdown of how each part of your application is performing.
At Mingle we used Stackify Retrace for APM.
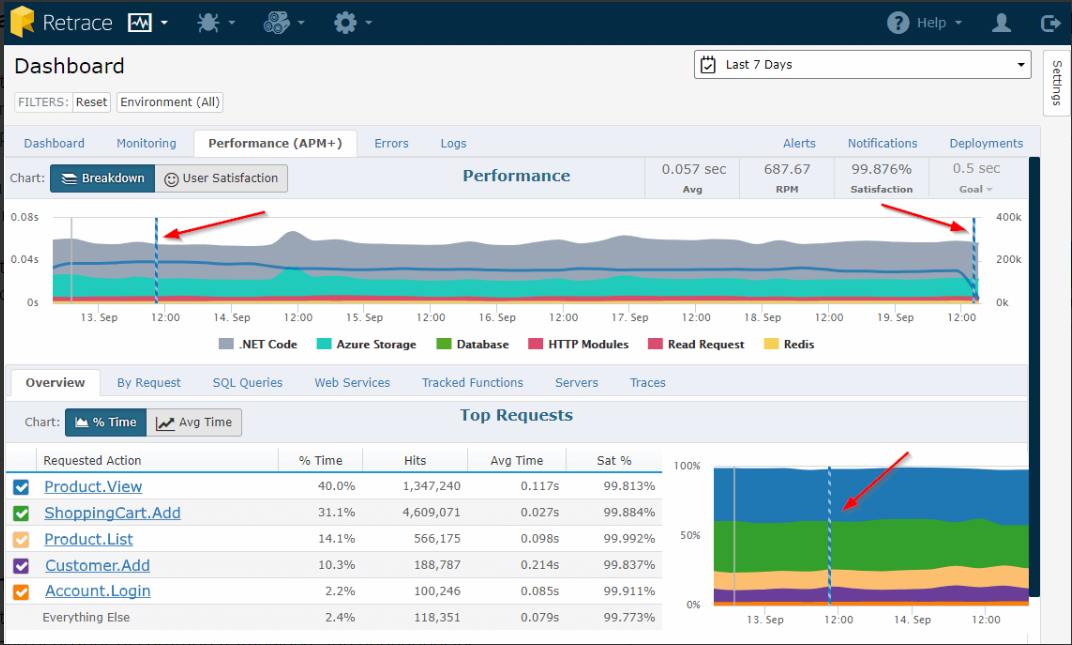
We were really impressed with the amount of information we received after installing Retrace:
- Graphs showing
- Number of requests
- Average timing of web requests
- A breakdown of where web requested time is spent (App code, database, Redis, etc)
- Performance by
- Request
- SQL query
- Web Service
- Code traces for slow or erroring code
Each of the above areas can be monitored and alerts can be sent when a threshold is breached.
Some APM Tools
Real User Monitoring (RUM)
RUM shows how a web application is performing from a users point of view:
- Who is logged in
- Number of users
- Location of users
- Page load performance
- Errors and crashes
- Feature usage
While APM is focused from the webserver down, RUM is focused on the web browser.
RUM is particularly important for applications that use the Single Page Application (SPA) model. In SPA applications most of the code runs in the web browser. It’s quite possible for the SPA to be completely down and have the back APM reporting nothing but a lack of traffic.
One of our main apps at Mingle was a SPA written in AngularJs. We decided to use Raygun to monitor our SPA application.
Raygun proved useful for:
- Seeing the page load times by page or by user
- Seeing performance issues from the user point of view
- Knowing the number of active users
- Identifying specific users that were having performance issues
- Catching front end errors
- Tracking user info such as browser type and location
We created a custom plugin for Raygun that would push errors and performance information to Stackify Retrace via a back-end API. This allowed us to have all of our error logging and alerting in one place.
Note that Raygun continues to evolve and now has many plugins to allow the export of alerts and data. Raygun is also starting to work in the APM space.
Some RUM Tools
Resources
Custom Metrics
While APM tools can give you quite a bit of metric information out of the box, it’s often necessary to complete the pictures using your own custom metrics.
Custom metrics are used for insight into both the technical and business sides of the application.
Typical metrics might be:
- Business
- Number of users per day
- Number of new users
- Number of sales
- Sales amounts
- Page views
- Features used
- Technical
- Errors
- Failed logins
- Performance of specific requests or actions
- Latency and response time of requests
- Volumes of data transferred
- Requests and responses
We used Retraces custom metrics to log page load times from Raygun as well as the number of logins and the performance of different parts of the system.
Custom metrics in Retrace are good for basic items but we ran up against the following limitations:
- All metrics are by the minute, no custom time frame.
- No support for using percentiles instead of average.
- Limited access to the metric data to perform our own analysis.
- There is a basic API for metric data but it allows you to access the same info as the dashboard, averaged by the minute.
Some tools with custom metrics support
Resources
Synthetic (Live) Testing
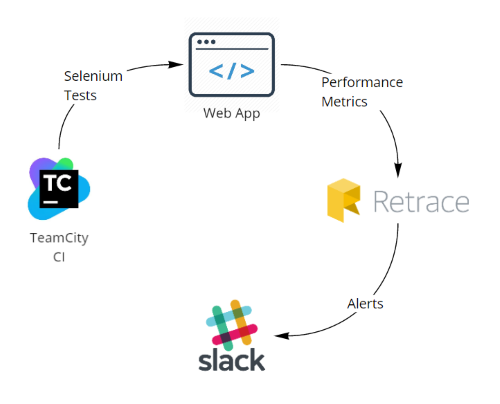
Synthetic testing means running tests in production.
We used custom metrics to monitor the performance of our synthetic tests and give us an early warning for any front end performance related issues.
We setup TeamCity to run Selenium tests which logged into the application as a test user and performed tasks. We would then track and alert on metrics based on the test user ID.
Alerting
Server level alerting was handled by LogicMonitor.
All other alerting was handled by Stackify Retrace and routed to Slack.
In Slack we had a dedicated “Production Issues” channel that was highly guarded and set up to always alert subscribers.
Alterting tip: Make sure alerts are real and infrequent. Too many alerts quickly turn into noise that is ignored.
Want to learn more?
Please reach out to me on Twitter, LinkedIn or contact me at TacomaSoftware if you want more details about application monitoring.